
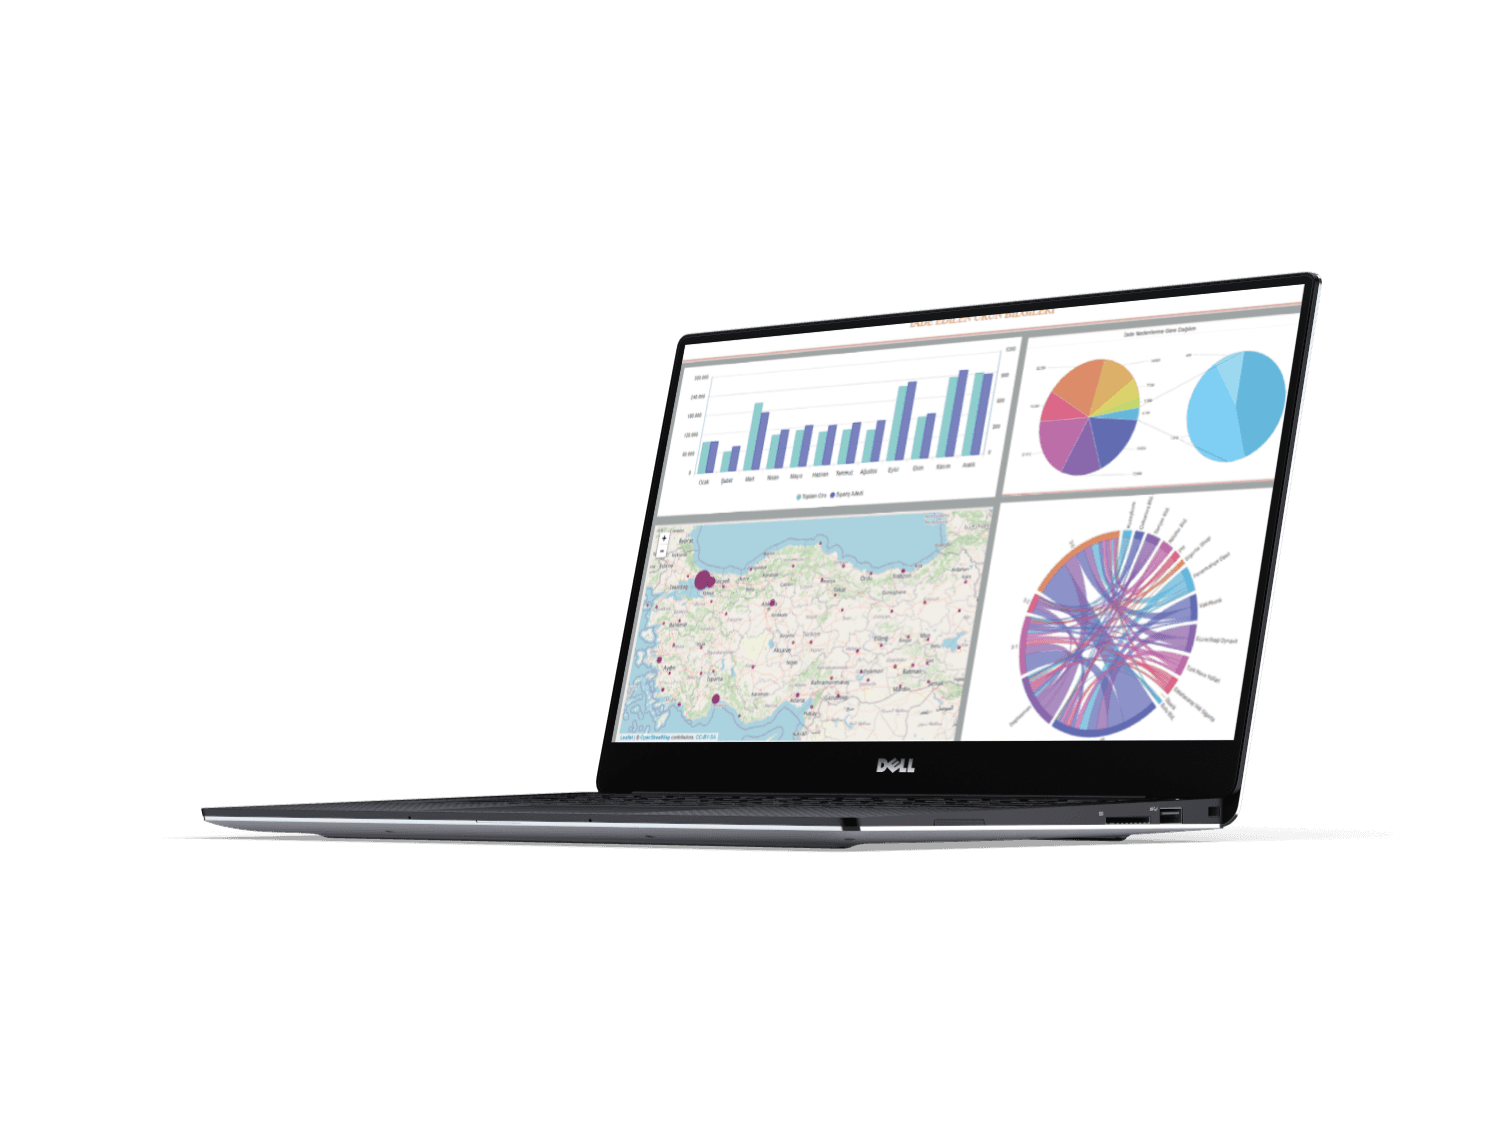
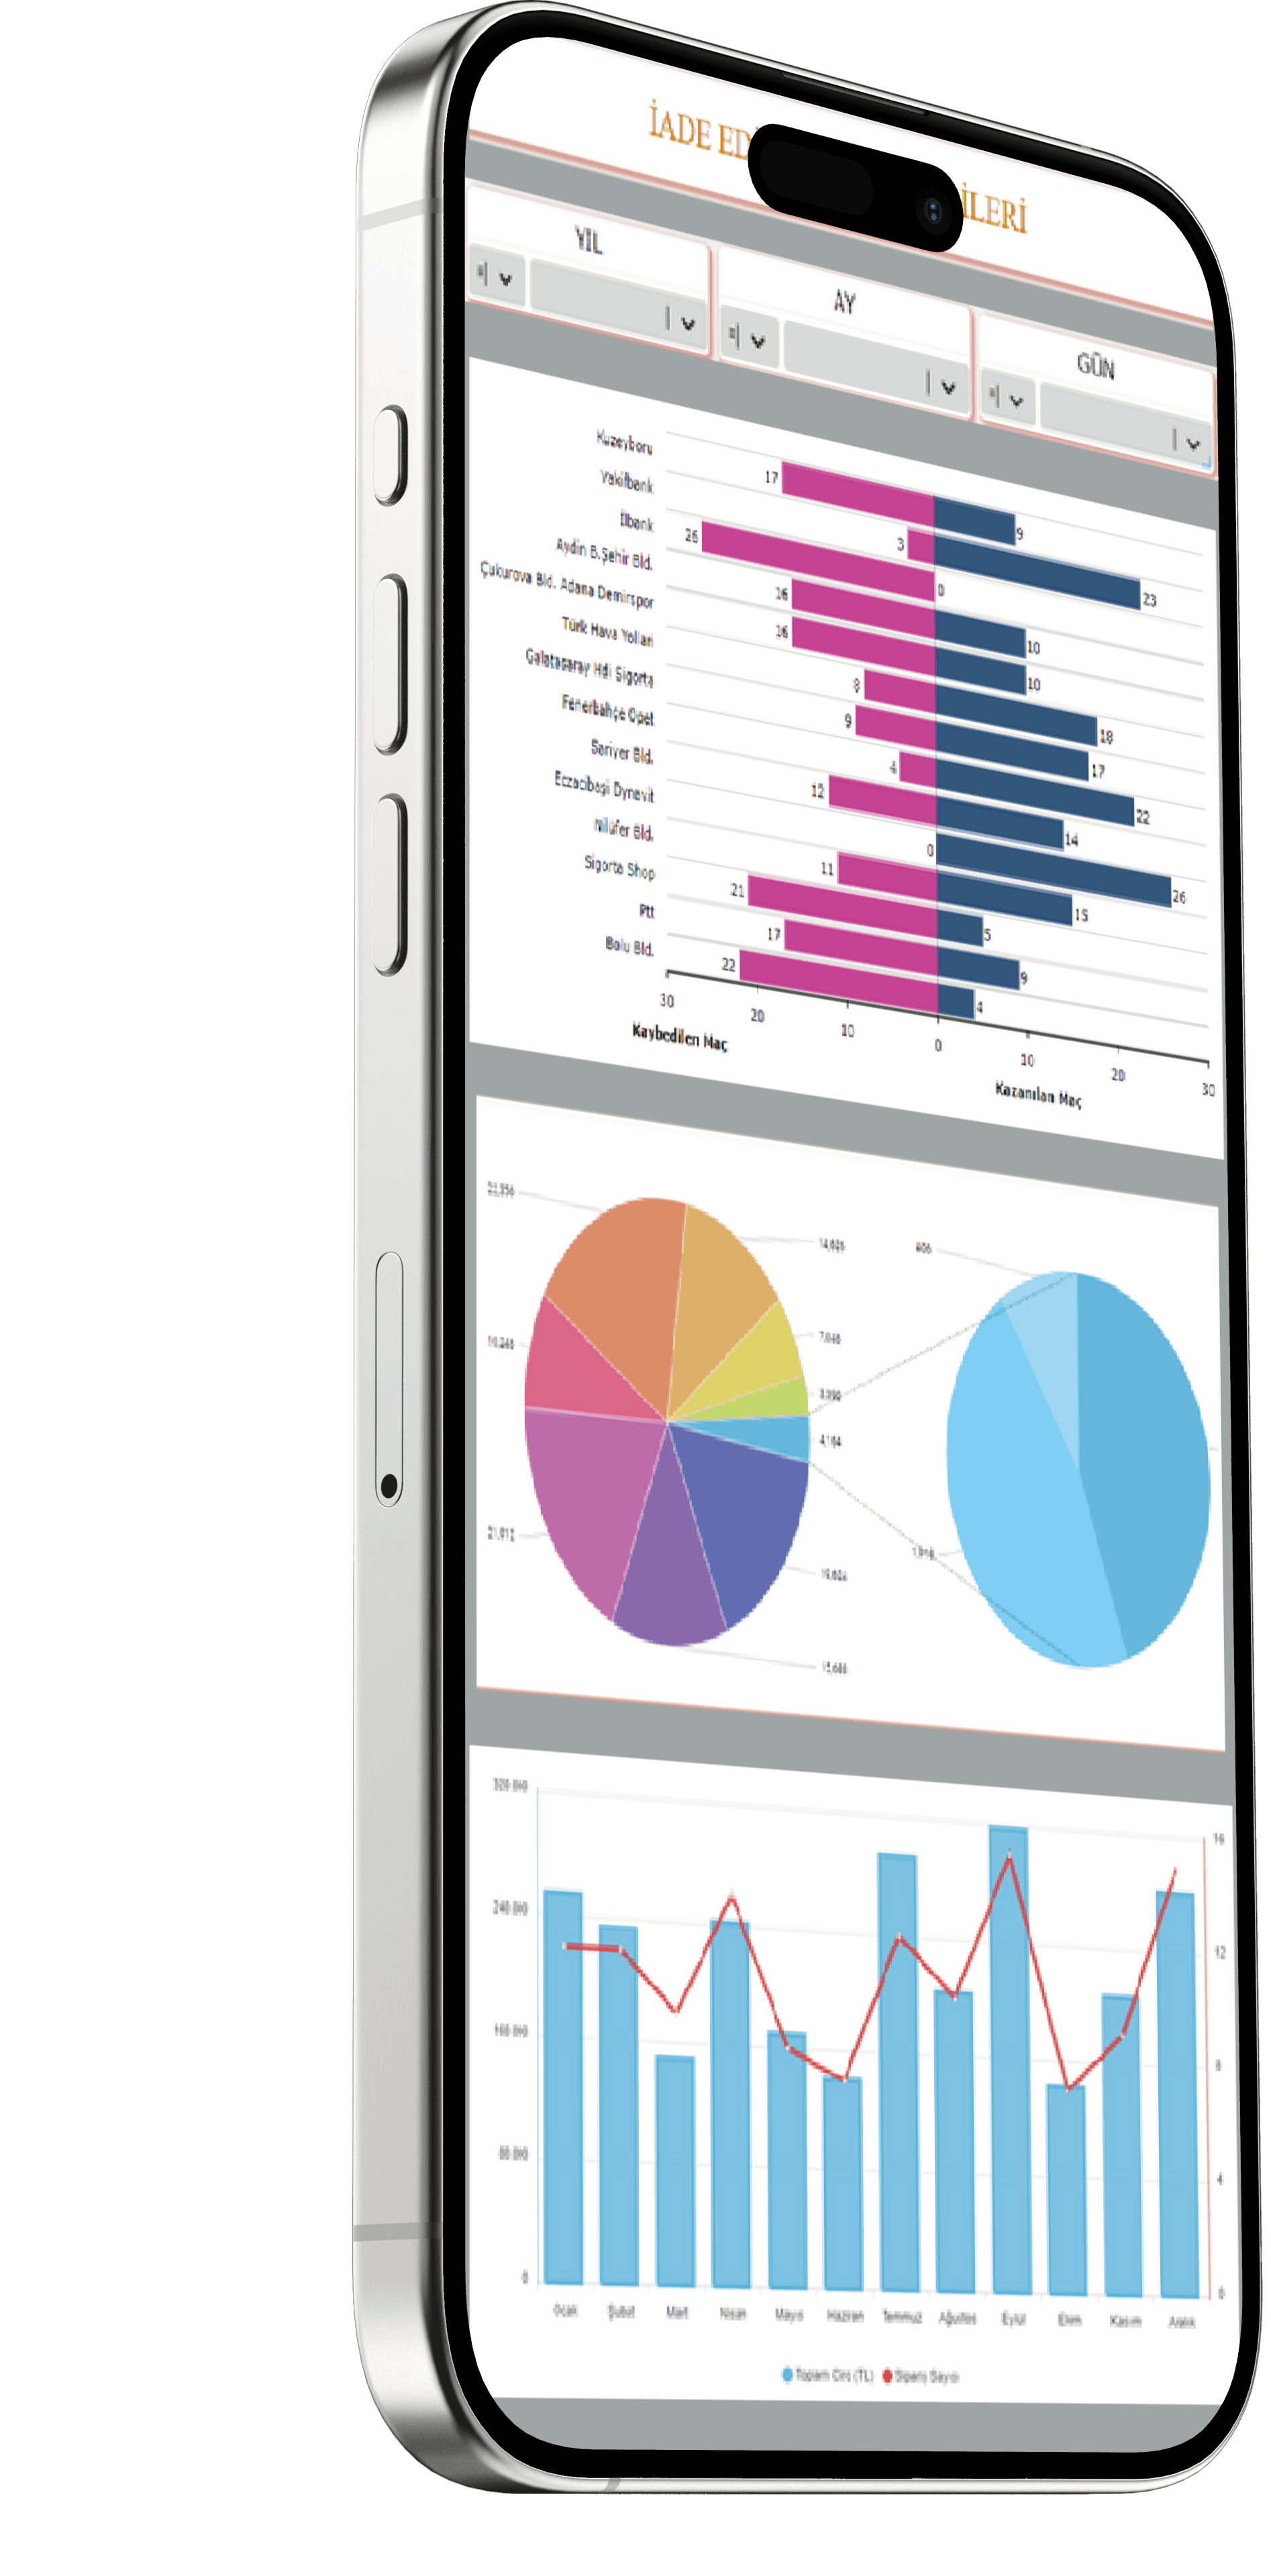


Why Vispeahen?
Why Vispeahen?


Connection can be established from anywhere in the world without installation through an internet browser.
Connection can be established from anywhere in the world without installation through an internet browser.


Provides time savings with fast and accurate actions.
Provides time savings with fast and accurate actions.


Increases efficiency by early detection of risks.
Increases efficiency by early detection of risks.


Data becomes more meaningful and understandable.
Data becomes more meaningful and understandable.

Can be easily applied to any desired sector (Finance, healthcare, education, marketing, logistics, etc.).
Can be easily applied to any desired sector (Finance, healthcare, education, marketing, logistics, etc.).
The Advanced Features
The Advanced Features


Drilldown Feature
Drilldown Feature
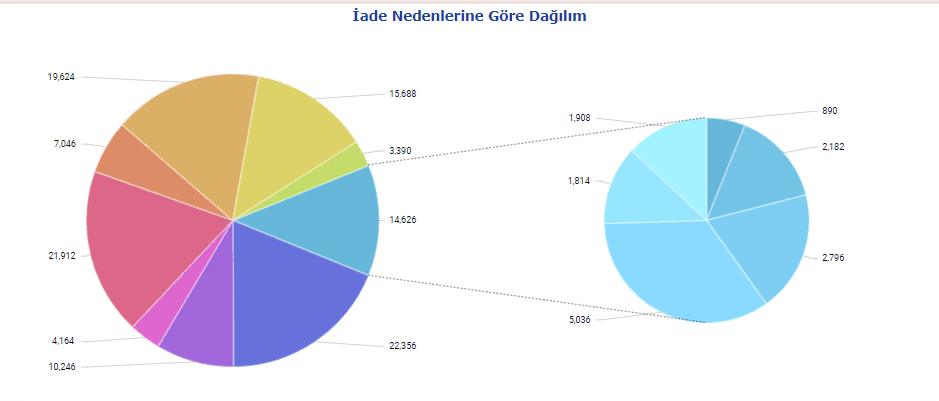
By delving into the data that creates the chart, a more detailed and specific analysis of the data can be performed. With Vispeahen's drilldown feature, the data shaping a chart can be detailed at various levels. For example, in the breakdown of a chart showing sales by category, detailed views at the gender level for a selected year can be displayed.
By delving into the data that creates the chart, a more detailed and specific analysis of the data can be performed. With Vispeahen's drilldown feature, the data shaping a chart can be detailed at various levels. For example, in the breakdown of a chart showing sales by category, detailed views at the gender level for a selected year can be displayed.

Navigation Feature
Navigation Feature
It allows transitioning from a dashboard screen containing summary information to a dashboard screen containing detailed information. During this transition, fields in the summary dashboard screen can be used as parameters.
It allows transitioning from a dashboard screen containing summary information to a dashboard screen containing detailed information. During this transition, fields in the summary dashboard screen can be used as parameters.


Conditional Formatting
Conditional Formatting
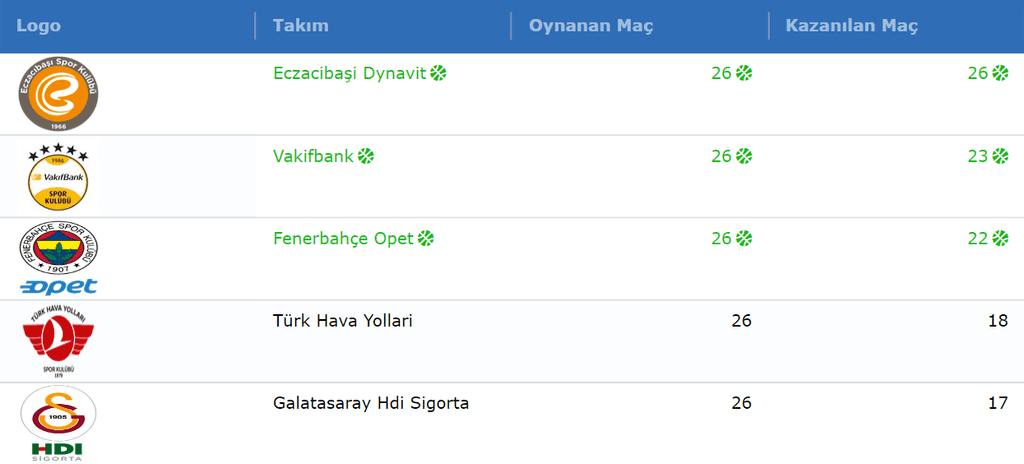
Conditional formatting is used to make data more understandable and emphasized based on specific conditions. In Vispeahen, data that meets the condition can be formatted with conditional formatting, making it easy to notice with visual markers such as icons.
Conditional formatting is used to make data more understandable and emphasized based on specific conditions. In Vispeahen, data that meets the condition can be formatted with conditional formatting, making it easy to notice with visual markers such as icons.

Advanced Cache
Advanced Cache
With Vispeahen's caching feature, the queries that generate the graphs on the dashboard are cached, providing advantages in terms of speed and performance. The graphs on the dashboard are cached until the cache validity time set by the user. This allows the user to achieve performance gains on data sets that do not change frequently.
With Vispeahen's caching feature, the queries that generate the graphs on the dashboard are cached, providing advantages in terms of speed and performance. The graphs on the dashboard are cached until the cache validity time set by the user. This allows the user to achieve performance gains on data sets that do not change frequently.
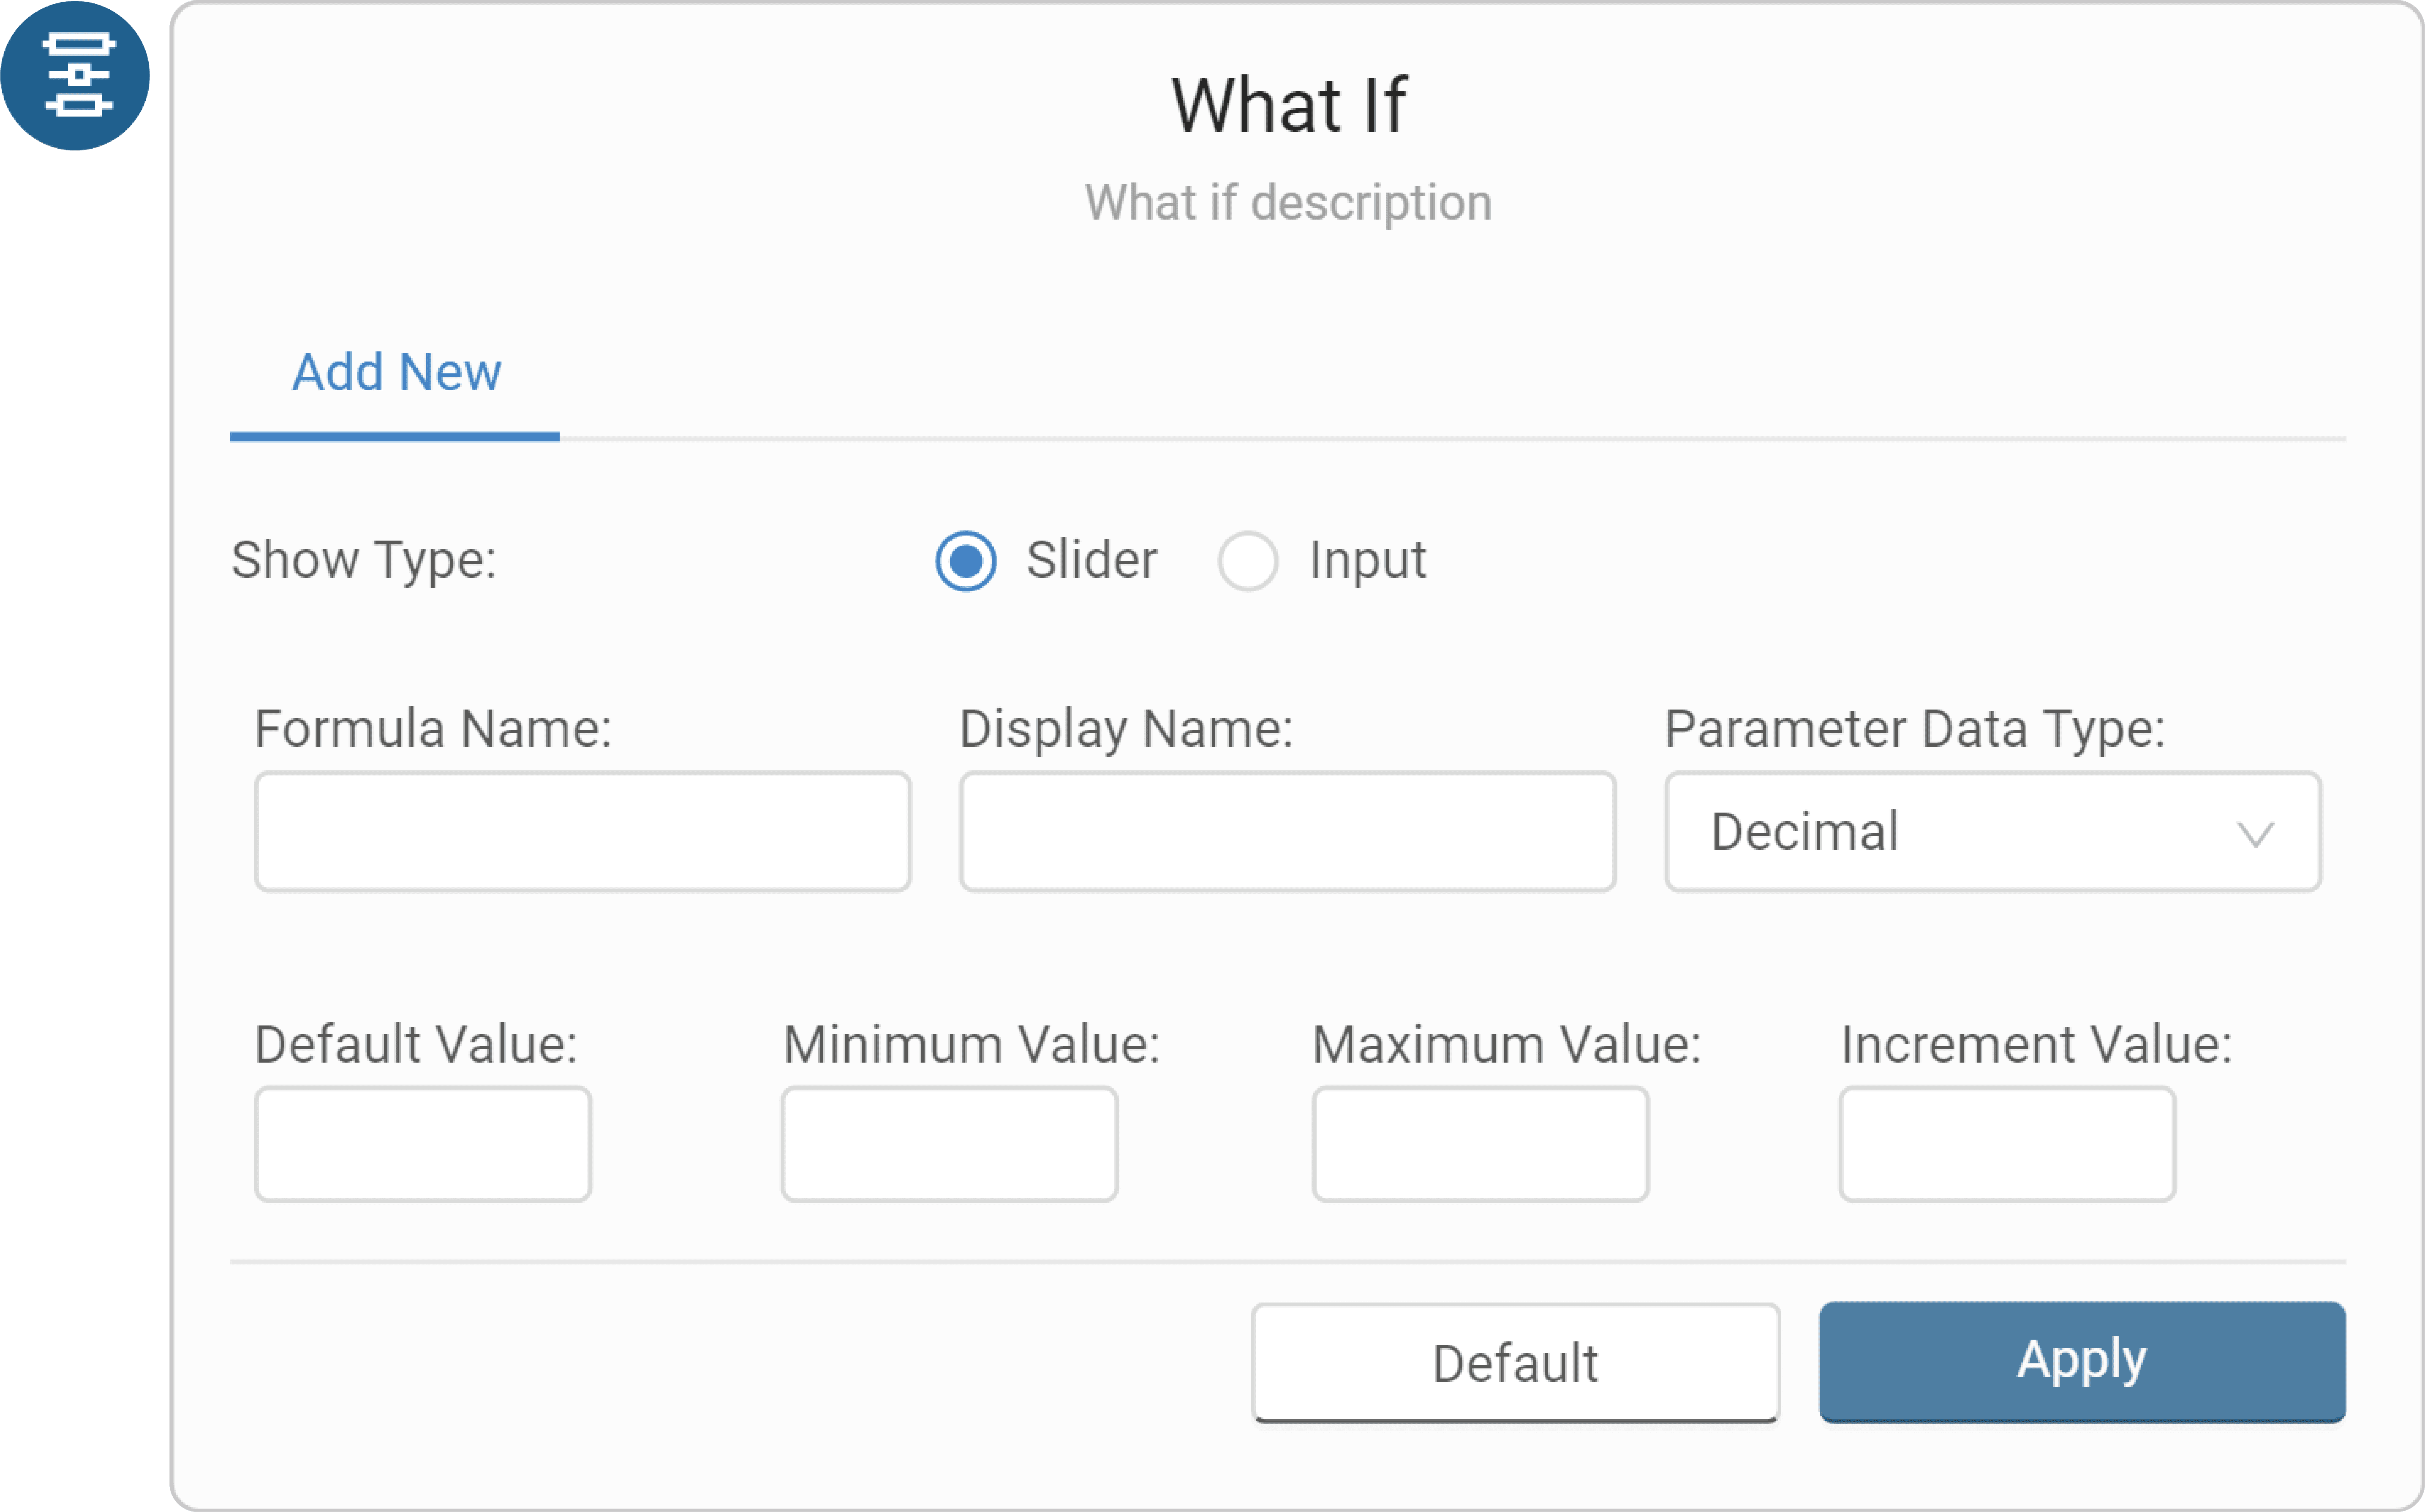


What If?
What If?
By changing specific parameters in the dataset, you can simulate how possible scenarios will be affected in advance. With Vispeahen's What-If Scenario feature, you can save the results as scenarios based on parameters, allowing you to be prepared for ever-changing conditions.
For example, in the sales dashboard mentioned above, the exchange rate parameter can be changed to examine the results. This way, you can take precautions well in advance for potential exchange rate fluctuations.

Embedded Use
Embedded Use
If there is an application used within the organization, dashboards created with Vispeahen can be accessed through the application without the need for a username/ password. This allows the dashboard screens to be embedded and published within the organization's application.
If there is an application used within the organization, dashboards created with Vispeahen can be accessed through the application without the need for a username/ password. This allows the dashboard screens to be embedded and published within the organization's application.


Personal Dashboard
Personal Dashboard
With the Personal Dashboard feature, when a user with read access opens the dashboard screen, they can make personal customizations that are visible only to them. This way, the user with read access can make their own personal changes without altering the original dashboard.
With the Personal Dashboard feature, when a user with read access opens the dashboard screen, they can make personal customizations that are visible only to them. This way, the user with read access can make their own personal changes without altering the original dashboard.

Report Generation
Report Generation
Report generation involves extracting data from data sources and producing output according to a designed template.
With the ability to add parameters, data can be downloaded according to the filters chosen by the user. Report generation retrieves data from sources and generates output in line with the designed template.
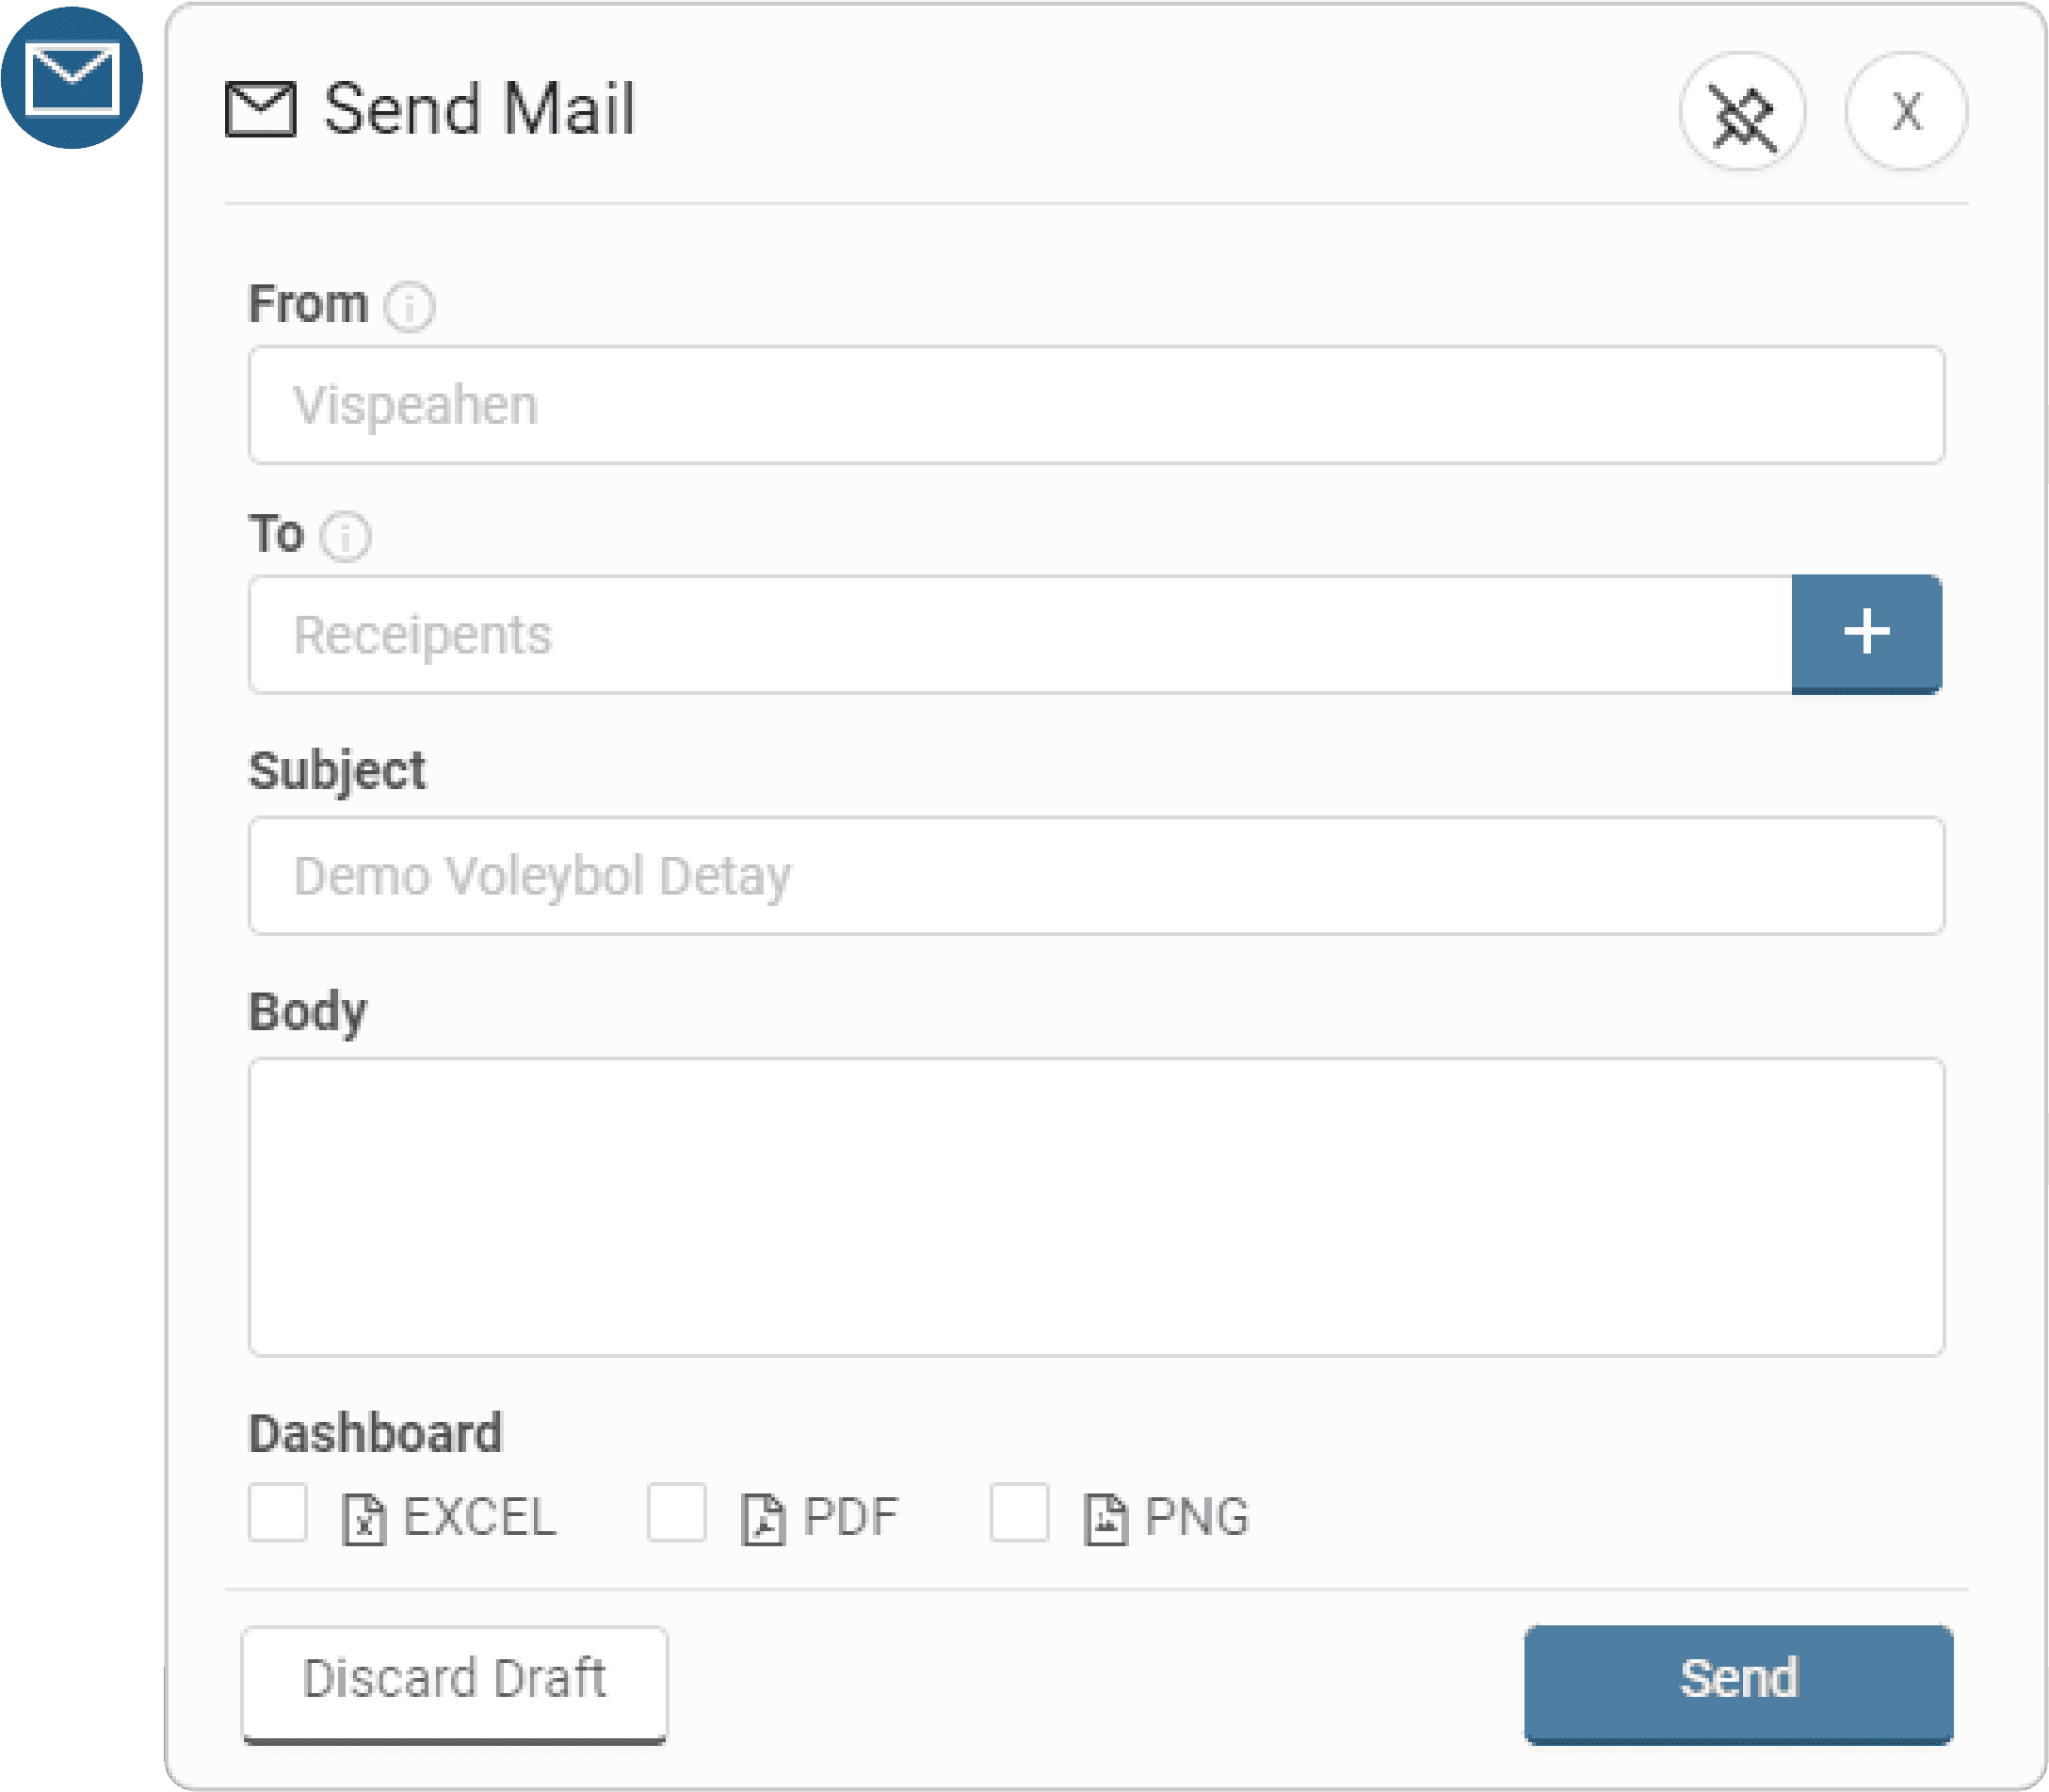

Email Sending
Email Sending
Real-Time Email Sending
It allows the dashboard screen to be sent in PDF/PNG/Excel format to designated email addresses in real time. This way, situations or changes that need to be reviewed can be monitored instantly.
It allows the dashboard screen to be sent in PDF/PNG/Excel format to designated email addresses in real time. This way, situations or changes that need to be reviewed can be monitored instantly.
Scheduled Email Sending
It enables one or more dashboard screens to be sent via email at specified times and frequencies. This makes it easier to monitor the dashboards by receiving scheduled emails at the designated times.
It enables one or more dashboard screens to be sent via email at specified times and frequencies. This makes it easier to monitor the dashboards by receiving scheduled emails at the designated times.

Map Integration
Map Integration
If there is a map layer used within the organization, it can be easily added and used through the interface.
If there is a map layer used within the organization, it can be easily added and used through the interface.

Permission Management
Permission Management
Vispeahen's tagging structure offers easily manageable permission options with system, tag, and row-based authorization features.
Vispeahen's tagging structure offers easily manageable permission options with system, tag, and row-based authorization features.

Stream Data Analysis
Stream Data Analysis
In an environment where data is updated at specific intervals, the data is monitored and analyzed in real time.
In an environment where data is updated at specific intervals, the data is monitored and analyzed in real time.
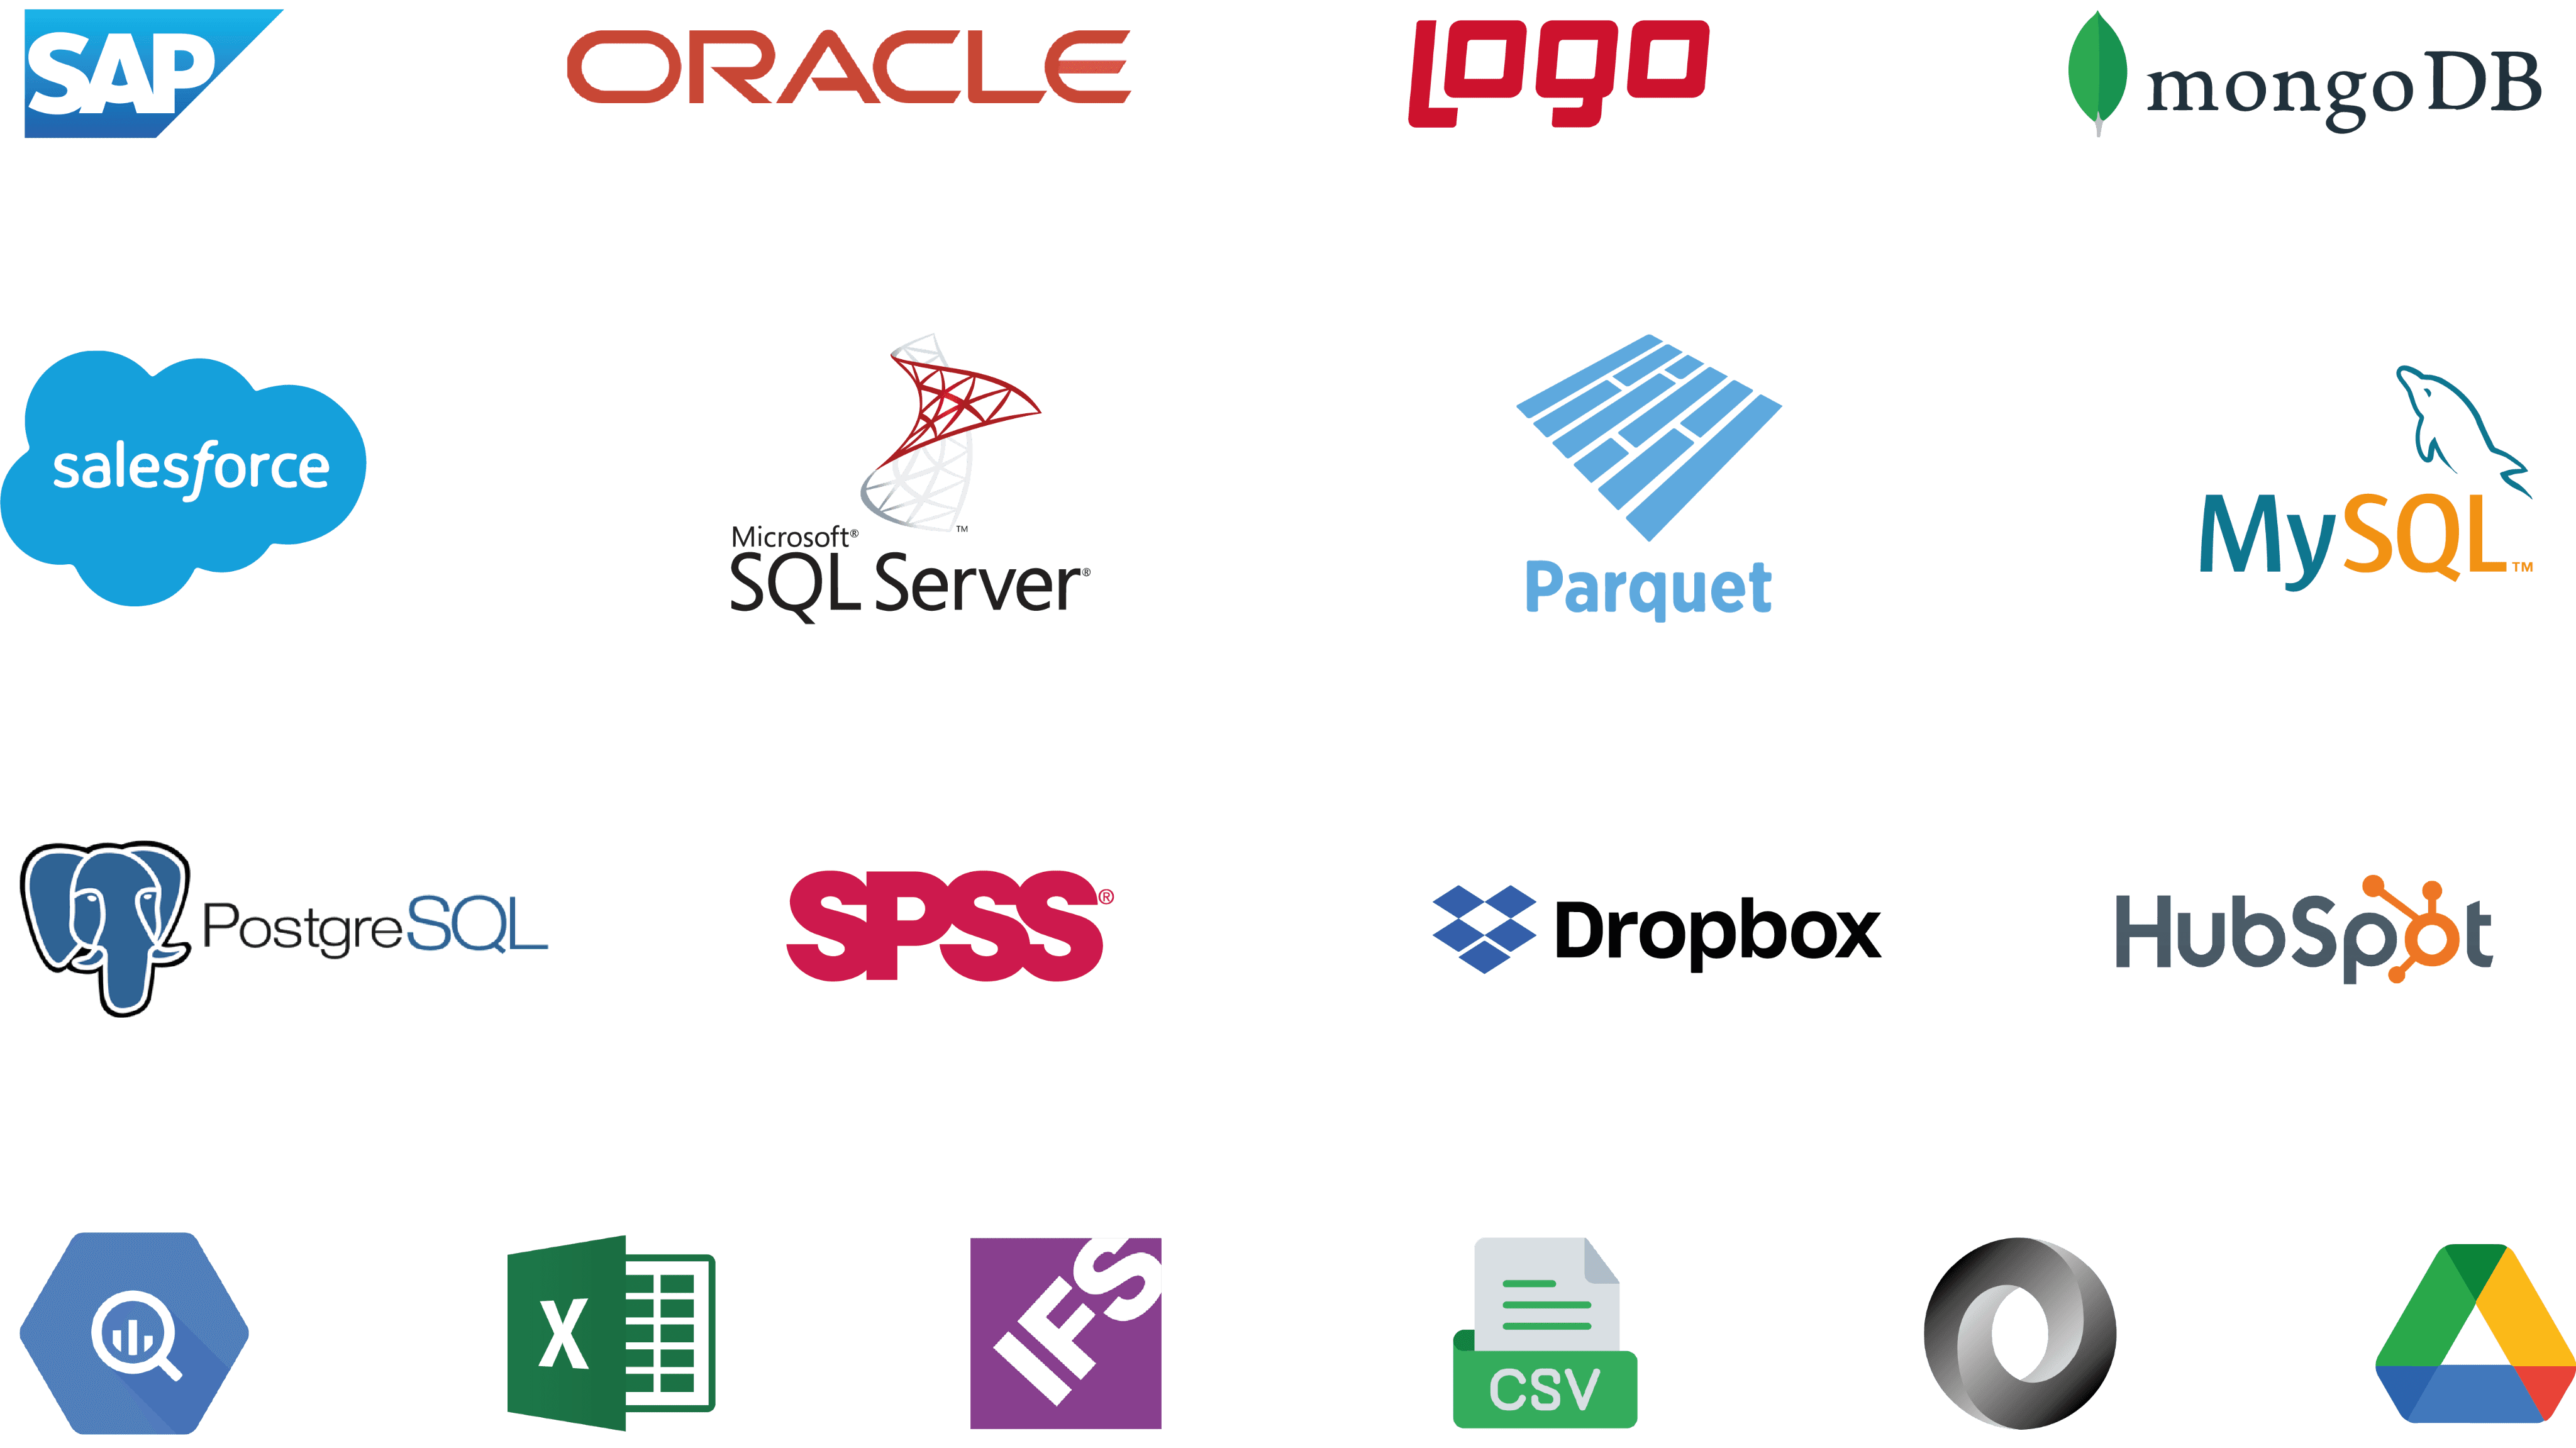


Connection to Different Data Sources
Connection to Different Data Sources
By connecting to various data sources (Relational/NoSQL/File/...), data is visualized.
By connecting to various data sources (Relational/NoSQL/File/...), data is visualized.

Mobile Application
Mobile Application
Through iOS and Android applications, access can be provided via phone/tablet. This allows for quick decision-making and immediate intervention.
Through iOS and Android applications, access can be provided via phone/tablet. This allows for quick decision-making and immediate intervention.

Happy Clients!
Hear what our clients have to say about us…
In this era of digital transformation, being able to work with data quickly is a crucial function. Vispeahen is our data analysis and visualization platform that we use to make data-driven decisions, continue to develop, and ultimately succeed.
Hüseyin Ciğeroğlu
Deputy General Manager

Vispeahen helps us quickly monitor and make data-driven decisions across all processes by creating robust and scalable solutions for a wide range of functions, from supply chain to production, within our company.
Taha Küçükpazarlı
General Coordinator

For our Edvars (Electricity Distribution Data Warehouse and Reporting) project, we chose Vispeahen. This allowed us to provide the desired reporting system flexibly and quickly. We are experiencing the advantage of reporting our data from various sources in the way we want.


Empowering Support Excellence
BiSoft Support Portal
BiSoft Support Portal is where our customers experience support services and receive assistance from our expert team. Our support engineering team is available 24/7 to address any issues in real-time.

Empowering Support Excellence
BiSoft Support Portal
BiSoft Support Portal is where our customers experience support services and receive assistance from our expert team. Our support engineering team is available 24/7 to address any issues in real-time.
Learn More

Empowering Support Excellence
BiSoft Support Portal
BiSoft Support Portal is where our customers experience support services and receive assistance from our expert team. Our support engineering team is available 24/7 to address any issues in real-time.


Happy Clients!
Hear what our clients have to say about us…
For our Edvars (Electricity Distribution Data Warehouse and Reporting) project, we chose Vispeahen. This allowed us to provide the desired reporting system flexibly and quickly. We are experiencing the advantage of reporting our data from various sources in the way we want.


In this era of digital transformation, being able to work with data quickly is a crucial function. Vispeahen is our data analysis and visualization platform that we use to make data-driven decisions, continue to develop, and ultimately succeed.


Hüseyin Ciğeroğlu
Deputy General Manager
Vispeahen helps us quickly monitor and make data-driven decisions across all processes by creating robust and scalable solutions for a wide range of functions, from supply chain to production, within our company.


Taha Küçükpazarlı
General Coordinator
Data Analysis and Visualization Platform
Data Analysis and Visualization Platform


Vispeahen is a data analysis and visualization platform. It transforms ever-increasing data from all fields into meaningful visuals that aid in decision-making. This way, you can move to accurate and data-driven decision-making without wasting time on complex data sets.
Vispeahen is a data analysis and visualization platform. It transforms ever-increasing data from all fields into meaningful visuals that aid in decision-making. This way, you can move to accurate and data-driven decision-making without wasting time on complex data sets.
Request Demo
Request Demo


